
Wall Street Killed the Wildcatters: $100+ Oil Now Means Bigger Buybacks With Fewer Jobs and Babies Than Ever Before
The last time oil hit $100, Houston built families. Now booms became a buyback — and the demographic bill comes due decades later.


Sunday morning, gasoline wholesalers started calling their customers to announce 25-cent-per-gallon price increases, effective immediately. “Clearly, there’s a whiff of panic there,” said Tom Kloza, an oil analyst and adviser to Gulf Oil. GasBuddy’s Patrick De Haan estimated that some stations would raise prices by as much as 85 cents per gallon by week’s end. The national average hit $3.00 for the first time since December. By Monday, European diesel futures had jumped 23 percent to a two-year high. Jet fuel, gasoline, naphtha, and high-sulfur fuel oil followed. European natural gas futures surged more than 50 percent, the sharpest single-day move since 2022, the kind of move that comes from physical supply disappearing, not traders repricing risk.
On Saturday, February 28, the war between the United States, Israel, and Iran began. By Sunday, the Strait of Hormuz, through which roughly 20 percent of the world’s seaborne oil transits daily, had effectively shut down, not because Iran imposed a formal blockade but because the insurance market made transit impossible.
Lloyd’s List tracked just 23 vessel transits through the Strait on March 1, compared to a January daily average of 10.3 million deadweight tons. Traffic was down 81 percent week-over-week. Just one crude oil tanker transited the Strait that day. Zero LNG carriers. At least four vessels had been struck in and around the waterway, including the Palau-flagged tanker Skylight, hit by a missile and set ablaze within Omani territorial waters. One crew member was killed on the Marshall Islands-flagged crude tanker MKD Vyom. At least 150 crude and LNG tankers dropped anchor in open Gulf waters, clustered off the UAE, Saudi Arabia, and Qatar.
Then the insurers pulled out. Seven of the twelve member clubs of the International Group of P&I Clubs, which provides marine liability coverage for approximately 90 percent of the world’s ocean-going fleet, issued cancellation notices for war risk coverage in the Persian Gulf. Steamship Mutual’s cancellation took effect 72 hours after midnight GMT on March 1. Maersk suspended all Hormuz transits. MSC instructed every vessel in or bound for the Gulf to proceed to designated shelter areas and suspended all worldwide cargo bookings to the Middle East. Hapag-Lloyd and CMA CGM halted transits and imposed emergency surcharges ranging from $2,000 per twenty-foot container to $4,000 for refrigerated units. Japanese lines NYK, Mitsui O.S.K., and Kawasaki Kisen halted all Hormuz operations. Services that could not transit Hormuz began rerouting around the Cape of Good Hope, adding weeks to delivery times.
Without war risk coverage, neither tankers nor LNG carriers can operate, regardless of whether the waterway is technically open. As Lloyd’s List put it, the Strait has been closed not by Iran but by shipping itself. “I don’t think Iran can shut down the Strait of Hormuz, but insurance companies and vessel operators can,” Kloza said. Even if the shooting stopped tomorrow, the insurance markets would take weeks or months to reopen.
The downstream effects compounded within hours. QatarEnergy halted LNG production at Ras Laffan, the world’s largest export facility, after Iranian drones struck the complex, and declared force majeure. Ras Laffan covers roughly a fifth of global LNG supply. Saudi Aramco shut units at Ras Tanura, the kingdom’s largest domestic refinery, after a drone strike. The loss of 4.3 million barrels per day of refined product exports from the Persian Gulf lifted refinery margins everywhere else on the planet. Diesel faces the most acute near-term physical pressure, according to Kpler, because it is the primary fuel for military logistics, regionally concentrated in supply, and the hardest petroleum product to replace quickly. Europe gets 45 percent of its jet fuel from the Middle East.
Brent crude surged as much as 13 percent intraday to above $82 a barrel, its highest level since January 2025. Barclays warned that Brent could reach $100 as the security situation spirals. JPMorgan said a prolonged disruption could push prices to $120. Deutsche Bank modeled a full Strait closure at $200. As recently as mid-February, Brent had traded in the low-to-mid $60s. Goldman Sachs had projected Q4 2026 Brent at $60; the EIA’s February forecast expected a $58 annual average. A Reuters poll had $63.85, with a geopolitical risk premium of $4 to $10 already priced in. None of these forecasts priced in a Hormuz closure, and by Saturday all of them were obsolete.
For American consumers, the arithmetic is already moving. A $10-per-barrel increase in crude translates to about 25 cents per gallon at the pump. Diesel price increases will bleed through to trucking surcharges, rail freight, and farm input costs just as spring planting begins. Seventy percent of consumers say gas prices affect their feelings about the economy, and energy costs feed into virtually every other price, from groceries to airfare to heating.
In every prior crisis when oil reached these prices, Houston responded. The 2008 spike produced 728,000 mining and logging jobs nationally (the BLS category that includes oil extraction) and 457,500 new positions in the Houston metro alone. High prices meant pain at the pump, but they also meant a compensating boom in the communities that produced the oil.
That industry no longer exists. The independents, the chaotic, debt-fueled ecosystem that converted price signals into production and employment, have been replaced by Wall Street’s capital allocators. The wildcatter era was volatile, environmentally damaging, and financially reckless in its debt-fueled form. Norway solved the governance problem with a sovereign wealth fund. Texas built a boom-bust cycle instead. But the underlying capacity to convert high prices into production and employment was sound. What replaced it is financially optimized and structurally unresponsive, an industry that no longer converts price signals into jobs regardless of what any president asks.
What follows starts with what $100 oil used to buy in Houston, and what it buys now, then documents the capital discipline regime that ensures the industry will not respond. It follows the price shock into the policy toolkit, where new Federal Reserve research shows the transmission from oil to interest rates has tripled in speed since 2021. Then it tracks the consequence almost nobody is discussing: oil shocks suppress fertility, the mechanism is now empirically documented at every link from barrel price to first birth, and the gendered structure of the employment shock means young men are hit hardest. It closes with what policymakers are getting wrong.
What did $100 oil used to mean?
Between 2010 and 2014, Houston added 457,500 jobs, with energy as the city’s primary economic engine. Direct oil and gas employment peaked at roughly 350,000 across the metro. But the real mechanism was the independents. In Corpus Christi, a land man could count 10 to 20 independent operators competing for acreage, each bringing in local doctors and lawyers as investors on well deals. The business model was straightforward: borrow to drill, prove reserves, ride the production upward or flip the asset to a larger player.
When prices were high, the model printed jobs and spread the money far beyond the wellhead. Roughnecks in Midland sent remittances to families in Houston’s eastern suburbs. Service company owners in Katy hired welders, dispatchers, equipment operators. For every direct upstream job, nearly three indirect and induced positions were supported across the Texas economy. A drilling boom meant overtime for pipe fitters, which meant down payments on houses, which meant work for roofers and electricians, which meant spending at grocery stores and car dealerships. Local banks lent against proven reserves. Landowners received royalty checks. School districts in the Permian funded new buildings with severance tax revenue. The cycle was volatile and occasionally ruinous in the busts, but during a price spike it converted global commodity prices into local wages, local consumption, and local tax revenue at scale.
Young men without college degrees could earn $80,000 to $120,000 a year on a rig crew. That income supported marriages, mortgages, and children in communities across West Texas, the Gulf Coast, and the Intermountain West. The boom towns had high birth rates not because of cultural attitudes but because stable income, affordable housing relative to wages, and confidence that the work would last a few years all arrived at the same time. When oil was high, Houston boomed, and the boom was labor-intensive enough to create the household conditions under which families form.
What does $100 oil mean now?
Energy and mining now accounts for 9.4 percent of Houston’s metropolitan employment, down from the city’s largest sector to its fifth-largest. Total upstream energy employment has fallen from approximately 350,000 at the 2014 peak to 290,000 by 2024. The Greater Houston Partnership projects that oil and gas extraction will lose positions in 2026, energy-adjacent manufacturing will lose positions, and administrative support will shrink. These were the baseline forecasts before the Strait of Hormuz closed.
Median household earnings in the metro area are $77,182. The energy cluster still pays $141,667 on average, but fewer workers can access that premium each year. South of the city, petrochemical plants in Texas City, Baytown, and Freeport use crude oil and natural gas as feedstock, not merely fuel, so rising crude prices hit them as direct input costs.
Thirty-year fixed mortgage rates remain between 6 and 7 percent, double the 2021 lows of roughly 3 percent. Monthly mortgage payments consume approximately 35 percent of median household income, a level that housing economists generally consider the threshold of unaffordability. The National Association of Realtors had predicted a housing recovery in 2026, driven by anticipated rate declines. An oil-driven inflation re-acceleration makes those rate cuts less likely.
In this industry’s new configuration, $100 oil is a cost with no compensating boom. The price increase flows through to every household. The employment surge that historically offset the pain is not coming.
Won’t the industry just drill more?
How Wall Street replaced the wildcatters
In 2008, when Brent peaked at $133 per barrel, the American energy sector’s response was immediate. Hundreds of independent E&P firms competed for acreage, services, and talent. When prices rose, production followed within months. The model was also debt-fueled and financially unsustainable, with many independents generating negative free cash flow for years.
The price crash of 2014–2015 triggered a wave of bankruptcies. The pandemic collapse of 2020, when West Texas Intermediate briefly traded at negative $37 per barrel, finished what the first crash started. Capital discipline became the industry’s permanent organizing principle, enforced by compensation structures, board mandates, and an investor base that would punish any reversion to the growth-at-all-costs model.
The result is visible in a single comparison (source: IEA/VisualCapitalist):
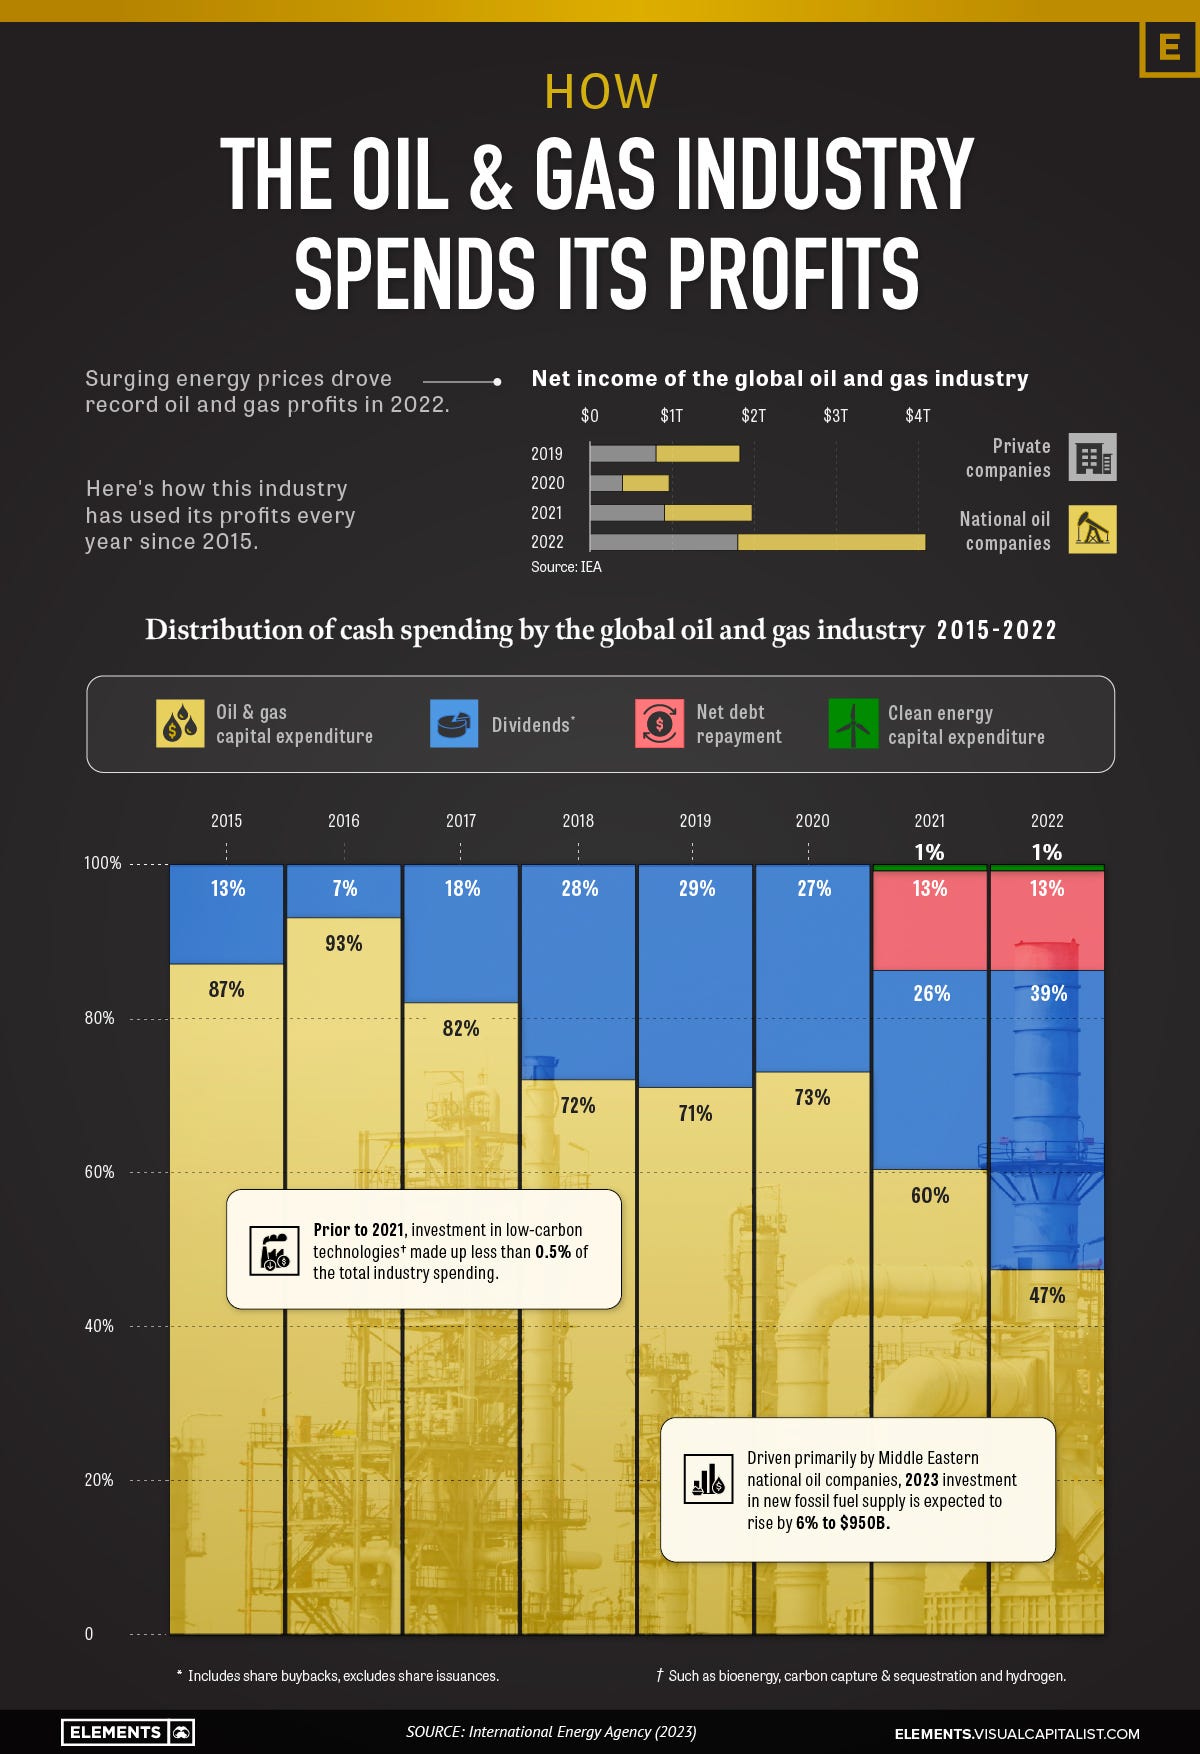
The pattern has only deepened. Between 2022 and the first half of 2025, nearly 45 percent of U.S. oil and gas companies’ cash flows went to dividends and share buybacks, according to Deloitte. Wood Mackenzie reported in late February 2026 that the 30 largest oil and gas companies now return 30 to 50 percent of operating cash flow to shareholders, cutting reinvestment rates to half of mid-2010s levels. The money no longer cycles through Houston’s economy. It flows to institutional shareholders and pension funds, most of whom are not in Houston and none of whom hire welders in Katy.
The first real test came in 2022. With crude above $100 for much of the year, the five largest publicly traded oil companies earned a combined approximately $199 billion. The global oil and gas industry earned nearly $4 trillion, more than double its recent annual average, according to IEA Executive Director Fatih Birol. The industry generated more cash than at any point in its history and used it not to drill but to buy back its own stock and raise dividends.
By early 2026, European majors including Shell, BP, TotalEnergies, and Equinor were cutting share buybacks as Brent lingered in the $60s, while U.S. supermajors ExxonMobil and Chevron reiterated their buyback pace. The industry’s response to lower prices was to return less cash and drill less. Its response to higher prices will be to return more cash and drill the same.
“Whether it’s $150 oil, $200 oil, or $100 oil, we’re not going to change our growth plans,” said Scott Sheffield, then CEO of Pioneer Natural Resources, now part of ExxonMobil following a $60 billion acquisition. EOG Resources’ Q4 2025 earnings call, held the day before the Iran strikes, committed to returning 90 to 100 percent of annual free cash flow to shareholders in 2026 and keeping oil production flat. Chevron recorded $12.1 billion in share buybacks during 2025, a record, and reiterated the pace through 2026. On Monday, ExxonMobil and Chevron shares surged more than 6 percent in pre-market trading. Investors were not pricing in a production surge. They were pricing in higher margins on the same barrels.
The machines that replaced the roughnecks
The rig count tells the story in one number. U.S. rigs declined from 750 in December 2022 to 550 for the week ending February 27, 2026, a 27 percent drop. Oil-directed rigs stood at 407, down 79 from a year earlier. In any prior era, a decline of that magnitude would have produced a corresponding drop in production. Instead, weekly crude output averaged 13.7 million barrels per day as of mid-February, just under the all-time high. In the Permian Basin, operators hold 239 rigs, down 65 from a year ago, yet production has barely budged, driven by extended-lateral drilling that now reaches 15,000 feet or more per well, up from 5,000 a decade ago.
The industry achieved extraordinary per-rig productivity, and in doing so, systematically eliminated the infrastructure for rapid scaling. The surplus rigs, the idle service crews, the speculative wildcatters who responded to price signals within months have all been deliberately dismantled.
The total upstream workforce is approximately 1 million full-time equivalents today, down from the 1.26 million peak. The industry shed 252,000 core jobs while producing substantially more energy. The labor required per barrel has been cut by more than half. Petroleum engineering graduates at U.S. universities collapsed from a peak of 2,615 in 2017 to roughly 623 bachelor’s degrees annually, a 76 percent decline. Some programs were nearly wiped out: Louisiana State down 89 percent, University of Oklahoma down 90 percent, Colorado School of Mines down 88 percent from their peaks. The mass layoffs of 2014 and 2020 damaged the industry’s reputation among young professionals so severely that high oil prices no longer pull students back. Even if companies reversed their financial strategy tomorrow, the workforce for a 2014-style surge does not exist.
The competitive ecosystem Houston lost
Matt Stoller has done a great job of describing paradise lost of Houston’s (well Texas as it’s Midland does the drilling. Houston writes the checks) O&G ecosystem. Since late 2023, the sector has absorbed nearly $200 billion in mergers: ExxonMobil acquiring Pioneer for $60 billion, Chevron acquiring Hess for $53 billion, and Diamondback merging with Endeavor for roughly $26 billion, among others. Half of the Midland sub-basin, the most productive tight-oil formation on Earth, is now controlled by two companies. Exxon cut approximately 2,000 jobs globally following the Pioneer acquisition. Chevron cut approximately 600 from Hess Tower in Houston. In prior oil shocks, hundreds of firms making independent decisions collectively produced a rapid supply response. Two firms do not behave that way.
The EIA’s January 2026 forecast projected U.S. crude output holding near the 2025 record of 13.6 million barrels per day in 2026, then declining 2 percent to 13.3 million in 2027, what would be the first annual drop since 2021. Dallas Fed Energy Survey respondents reported breakeven prices of $61 to $62 per barrel in the Permian, barely above the EIA’s pre-crisis price forecasts. Wood Mackenzie’s analysis, published two days before the strikes, warned that production from current commercial projects across the 30 largest companies will fall nearly 40 percent between 2025 and 2040, a gap equivalent to adding two Permian Basins. The industry was already in decline before the Strait of Hormuz closed, and nothing about the current crisis changes the incentive structure.
Can’t the government do something?
If Houston’s oil industry is structurally configured not to respond, the question becomes what governments can do instead. Every major tool in the kit was designed for an industry that no longer exists.
Strategic Petroleum Reserve
The Strategic Petroleum Reserve holds roughly 415 million barrels as of late February 2026, about 57 percent of capacity. The Biden administration released 180 million barrels in 2022, the largest emergency drawdown in U.S. history, drawing the reserve to a 40-year low of 347 million by July 2023. Treasury estimated this lowered retail pump prices by 17 to 42 cents per gallon. The administration partially refilled it, purchasing or retaining roughly 200 million barrels at an average of $74.75. But DOE must still sell 99.6 million barrels by 2031 under existing congressional mandates, and Trump’s pledge to fill the reserve completely would cost an estimated $20 billion. At current levels with a maximum drawdown rate of 4.4 million barrels per day, the reserve covers roughly 94 days of net imports. A release can shave cents off the gallon for weeks. It cannot substitute for ongoing production if the Hormuz disruption persists for months.
The SPR could have been more than an emergency dump valve. Employ America, the research group that designed much of the framework the Biden administration adopted, proposed using fixed-price forward contracts and put optionsto create a soft price floor for domestic producers, offering insurance against the crashes of 2014, 2016, and 2020 that had conditioned capital discipline in the first place. DOE finalized a rule in October 2022 allowing fixed-price forward purchases, but execution lagged, and Employ America publicly warned that DOE appeared “spooked” by weak initial bids. Used strategically, the SPR could function as a market-stabilization mechanism that addresses one of the root causes of capital discipline. The administration that came closest ran out of time. The current administration has shown no interest.
OPEC+ agreed on March 1 to raise output by 206,000 barrels per day from April, exceeding analyst expectations of 137,000 but still less than 0.2 percent of global demand. The group holds roughly 3.5 million barrels per day of spare capacity, nearly all concentrated in Saudi Arabia and the UAE, the same countries now absorbing Iranian missile strikes. As Rystad’s Jorge Leon noted, if oil cannot move through Hormuz, production targets matter less than logistics and transit risk. The net supply loss, accounting for pipeline bypass capacity, is still 8 to 10 million barrels per day.
Interest rates
Raising interest rates does not put oil in the Strait of Hormuz. Yet the central bank response was immediate. Markets increased bets that the Fed would remain on hold at its March meeting and potentially through the summer. Monday’s ISM manufacturing data showed more than 70 percent of managers reporting higher prices in February, an 11.5 percentage point jump from the prior month, and that was before the oil spike hit. The Globe and Mail’s assessment was blunt: it is increasingly questionable whether the Fed will cut rates at all this year, and it may end up raising them. Ten-year Treasury yields posted their largest single-day advance since October.
The speed of this transmission has itself changed. A December 2025 SF Fed Economic Letter found that two-year Treasury yields now respond more than three times as strongly to oil supply news as they did in the pre-2021 period. The heightened sensitivity dates to the Fed’s 2022 liftoff and reflects markets pricing in a more aggressive central bank response to oil-driven inflation. For households, this means the pass-through from barrel to mortgage rate is faster and steeper than in any prior oil shock.
The pattern replicated globally. In Europe, Reuters reported that the disruption would cloud the outlook for both the ECB and Bank of England, potentially forcing postponement of further rate cuts. Deutsche Bank’s base case before the strikes was already for the ECB to hold through 2026, with the next move a hike in mid-2027. The timing is brutal: the eurozone had just hit its 2 percent inflation target in December for the first time in three years. Germany’s €500 billion fiscal expansion was supposed to provide a tailwind. An energy shock from the Gulf threatens to undo that progress in weeks. In Asia, OCBC economists warned that “monetary policy easing bias will be put to the test” across the region, with net energy importers facing simultaneous inflation, currency depreciation, and deteriorating trade balances. In Africa, nine countries including Nigeria, Kenya, and Egypt had cut rates just last month; Bloomberg reported Monday that the oil shock now threatens to derail that entire easing cycle.
The modeling underscores the scale. Capital Economics calculates that oil sustained at $100 a barrel would add 0.6 to 0.7 percentage points to global inflation. Oxford Economics models a more severe scenario: a Hormuz closure lifting Brent to $130 could push U.S. inflation to 4.5 percent and eurozone inflation close to 4 percent, derailing expectations of monetary easing entirely.
The question is whether tightening in response to a supply shock is the right prescription. Bernanke and Blanchard found that energy price shocks accounted for nearly all of inflation’s rise in late 2021 and early 2022, and nearly all of its decline in the second half of 2022. Tight labor markets contributed negatively to inflation in 2020 and early 2021.The wage-price spiral never materialized. Real wages fell. If central banks hold or cut into an oil-driven inflation spike, they risk unanchoring inflation expectations. If they raise rates, they apply what Bernanke’s own research showed was the wrong tool for the problem. As one macroeconomic analyst noted, the near-term implications are hawkish regardless. But the industry transformation described in Section III makes the dilemma worse on either path. In the old system, high prices triggered a production surge that moderated prices within months, keeping tightening cycles short and shallow. That self-correction no longer happens. Central banks tighten, prices do not moderate through new supply, and the costs, higher mortgage rates, slower hiring, weaker currencies in import-dependent economies, compound on households with no offsetting energy boom to cushion the blow.
Fiscal buffers
The fiscal buffers that governments used to cushion the last oil shock have been substantially depleted. Global public debt reached $102 trillion by 2024. Following the post-COVID expansions, 143 countries implemented fiscal consolidation measures affecting an estimated 85 percent of the global population: 91 governments capped public-sector wages, 80 cut energy and food subsidies, 86 raised consumption taxes, and over 120 restricted social safety net eligibility.
Renewable energy
If energy price shocks drive inflation, expanding energy supply is the direct response. Every gigawatt of renewable capacity installed is a gigawatt of demand permanently removed from the fossil fuel market. Between January and May 2025, China alone added 198 gigawatts of solar and 46 gigawatts of wind. Total installed Chinese solar capacity now exceeds 1,000 gigawatts, roughly half the world’s total.
Current U.S. policy moves in the opposite direction. The administration’s legislative agenda, the One Big Beautiful Bill, would phase out wind and solar production tax credits by 2027 and introduce new excise taxes on renewable energy projects using Chinese-manufactured inputs, reducing renewable energy capacity additions substantially over the next decade. Independent analyses project this could increase average household energy costs by approximately $400 per year within a decade from ending renewable credits alone.
A major oil supply disruption happening at the same time as legislation that reduces alternative energy supply capacity increases household exposure to exactly the kind of price volatility now unfolding. The administration authorized the military action that created the supply shock. It is pursuing legislation that reduces the capacity to build the alternative supply that would buffer against it.
What does an oil shock do to birth rates?
The metric that hides the problem
The Total Fertility Rate, the number every government tracks and every headline cites, loses critical information by collapsing two independent measures into one. A 2025 study in Scientific Reports (a Nature portfolio journal) by Stephen J. Shaw, analyzing data from 314 million mothers across 33 higher-income economies and 1,470 country-years, demonstrates the problem.
The decomposition is straightforward:
TFR = TMR × CPM
The Total Maternal Rate (TMR) measures the proportion of women who become mothers. Children per Mother (CPM) measures the average family size among those who do. TFR is the product.
These two components are statistically independent. Shaw confirmed this through breakpoint co-occurrence testing, wavelet coherence analysis, and Mutual Information testing. When TFR declines, policymakers cannot tell whether fewer women are entering motherhood or whether mothers are having smaller families. The policy implications are different in kind, not just degree. The 2024 UN World Fertility Report mentions childlessness twice across 62 pages.
What oil shocks do to motherhood rates
The oil crisis suppressed entry into motherhood rather than reducing family size among women who were already mothers.
The United States offers the more recent case. TFR in 2016 was identical to TFR in 1980: 1.82. But TMR had fallen from 76.1 percent to 69.4 percent, nearly 7 percentage points, masked by a simultaneous rise in CPM. Mothers were having slightly larger families, offsetting the growing number of women who never became mothers. Anyone relying on TFR alone would have missed it. The structural break coincided with the 2008 financial crisis.
Oil prices climbed toward $147 per barrel by July 2008, and gasoline hit $4 per gallon early that year, well before the Lehman collapse. The housing bubble burst partly because households already strained by energy costs began defaulting on mortgages. Fertility rates that had been rising across advanced economies reversed sharply. In the United States, TFR fell from 2.12 in 2007 to 1.8 by 2016. In Greece and Spain, which suffered a double-dip recession, TFR dropped from 1.5 to about 1.3. Across the five largest developed economies, 350,000 fewer babies were born in 2012 than in 2008.
But TFR again obscures what actually happened. The sustained decline was driven more by falling first births than by higher-order births, consistent with rising childlessness. Kearney and Levine (2022) found that the Great Recession contributed to the initial decline, but that women born after the mid-1980s continued having fewer first births at every age, even as the economy recovered. Comolli and Bernardi (2015) showed the mechanism: the downturn increased childlessness by lowering first-birth rates among women in their late thirties, women for whom delay meant, biologically, permanent childlessness. Demographers at the Carsey School noted the same pattern in the Great Depression, which produced the highest level of childlessness ever recorded in U.S. history. The economic shock was temporary. The TMR decline was not.
In Europe, the strongest fertility declines tracked the worst labor market deterioration: Southern Europe, Ireland, and parts of Central and Eastern Europe. The academic literature is consistent: childless young adults are most affected by economic downturns, and the longer a recession delays first births, the more likely those delays become permanent.
Has this already happened?
Before the 2022 energy crisis, something surprising had been happening across much of the developed world: fertility was recovering. The IMF documented that fertility rates had been rising across advanced economies in the decade before 2008. Even then, it is not all doom and gloom. France’s TFR held above 1.8 through 2017 (without immigrants factored in). Bulk of the Nordic countries maintained rates near or above 1.7 for most of the decade. The Czech Republic climbed steadily from 1.28 in 2003 to 1.83 by 2021. The United States saw a mini-baby boom during COVID, which ended in 2023, around the time of rate hikes and oil prices biting. The “Discourse” (or the more serious parts of it) debated whether the recovery was real or fragile. The 2022 energy shock answered that.
Russia’s invasion of Ukraine sent energy prices across Europe to levels not seen in a generation. Natural gas prices on the Dutch TTF benchmark rose more than tenfold from 2021 lows. Consumer price inflation in Central Europe, where dependence on Russian gas was heaviest, hit double digits and stayed there. The countries that had been recovering fastest proved the most vulnerable.
Hungary had been the poster child for pronatalist policy. A decade of aggressive interventions, including zero-interest loans, tax exemptions for mothers, debt forgiveness, and housing grants, had lifted the country’s TFR from 1.23 in 2011 to 1.59 by 2021, from worst in the EU to ninth best. Then the energy crisis hit. Hungary’s inflation surged above 25 percent in early 2023, driven heavily by energy and food costs. TFR fell from 1.59 in 2021 to 1.56 in 2022 to 1.51 in 2023, then collapsed to 1.39 in 2024, Hungary’s lowest rate in more than a decade, erasing most of the gains from a decade of policy effort. Marriages fell from 72,000 in 2021 to 50,200 in 2023 to 46,550 in 2024, with the sharpest declines among young people in their mid-to-late twenties. The Hungarian Conservative acknowledged that “the COVID-19 pandemic, the war in Ukraine, the energy crisis and economic difficulties on a global scale have also shaken families’ sense of security.” The most expensive pronatalist program in Europe could not withstand two years of energy-driven inflation.
Going back to the Czech Republic. Czecha’s collapse was even more dramatic. As recently as 2021, Czechia had one of the highest fertility rates in Europe at 1.83, higher than France. Then consumer prices surged past 15 percent inflation, and real wages fell in every quarter of 2022 and 2023. TFR dropped 10.4 percent in a single year, from 1.83 to 1.64, the largest single-year decline recorded among EU member states. It kept falling, to 1.53 in 2023 and then 1.37 in 2024, the lowest since records began in 1806, with only 84,000 births. The head of demography at Charles University warned that current-year fertility could reach 1.25. The OSW Centre for Eastern Studies linked the decline directly to falling living standards and collapsing security perceptions: the share of Czechs expressing concern about the threat of war rose from 11 percent in 2021 to 43 percent by 2023. Czech demographer Eva Waldaufová found that 89 percent of survey respondents cited a lack of affordable housing and 88 percent cited financial uncertainty as reasons for having fewer children than desired.The majority still wanted two children but were not reaching that number.
Shaw’s framework predicts the TMR component absorbed the blow disproportionately. The marriage collapses in Hungary and the first-birth delays in Czechia point in the same direction: it is entry into parenthood, not family size among parents, that the energy shock disrupted.
Who is going to be hit hardest in 2026?
Young men are going to be hit harder than any other demographic group. Young men are the population whose economic status most directly determines whether first births happen.
Start with the labor market channel. Elder and Payne (2024), writing in Energy Economics, found that oil price uncertainty shocks produce asymmetric effects on U.S. unemployment by gender, with men disproportionately affected. The industries most exposed to oil-driven cost shocks (construction, manufacturing, transportation, logistics) are the same industries that disproportionately employ young men without college degrees. When diesel prices rise 23 percent in a day, as they did on Monday, the trucking companies, freight operators, and construction firms that absorb those costs respond by freezing hiring or cutting hours.
The connection between male employment and first births is not speculative. A 2025 study by Han and Uchikoshi, published in the Chinese Sociological Review, found that the entire Korea-Japan fertility divergence is concentrated in women aged 25 to 29, and that approximately a third of Korea’s decline in this age group traces to a near-tripling of male economic inactivity. Among Korean men aged 25 to 29, the share neither working nor seeking work rose from roughly 10 percent in the mid-1990s to 30 percent by the early 2020s. In Japan it barely moved. Male inactivity suppresses first births specifically: men who are not in the labor force do not marry, and in both countries, marriage remains effectively a prerequisite for childbearing.
The 2026 oil shock arrives into this dynamic through three reinforcing channels. Diesel surcharges and rising input prices will slow hiring in male-dominated blue-collar sectors during what should be the spring ramp-up in construction and agriculture. The SF Fed’s finding that Treasury yields now respond three times more strongly to oil supply news means mortgage rates will rise faster than in any prior shock, pushing homeownership further from reach for young couples. And seventy percent of consumers already say gas prices shape their perception of the economy, so the psychological effect of watching pump prices climb daily compounds the material cost. For women in their mid-to-late thirties already at the edge of the biological window, any postponement of a partner’s proposal or a couple’s timeline risks becoming permanent childlessness.
Each successive shock operates on a lower baseline, which means the same-sized disruption does more damage. A 5-percentage-point TMR decline from 90 percent leaves 85 percent entering motherhood. The same decline from 60 percent leaves 55 percent entering motherhood and 45 percent remaining childless. The same absolute shock produces qualitatively different outcomes depending on where it lands.
The following table presents TMR data from Shaw’s study (please note, I will update these to DataWrapper when I have some spare time)
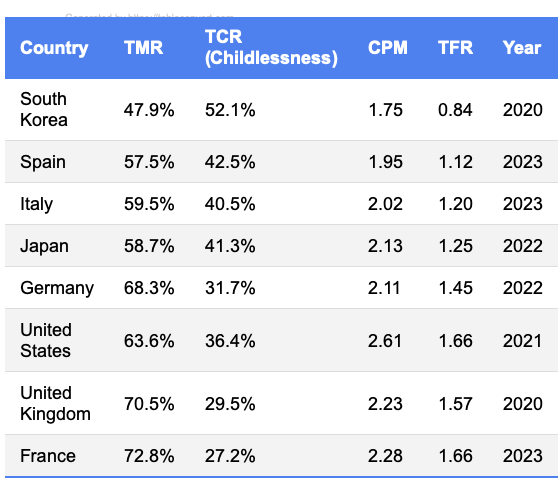
A TMR of 47.9 percent means that more than half of South Korean women are projected to remain childless.
We can calculate the TMR required to achieve replacement-level fertility (TFR ≈ 2.1) given each country’s current CPM:
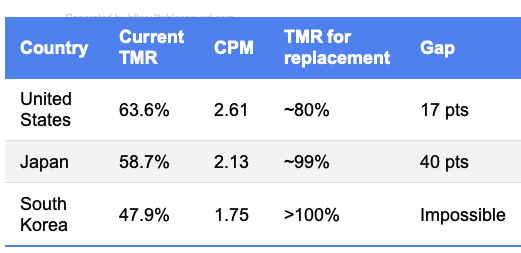
For South Korea, replacement TMR would need to exceed 100 percent, meaning replacement fertility is mathematically impossible through motherhood rates alone, regardless of policy. The Han and Uchikoshi data explain why: male economic inactivity has suppressed marriage rates so severely that no achievable increase in family size can compensate.
What are policymakers getting wrong?
Houston’s wildcatter industry converted $100 oil into jobs, wages, and community investment. Houston’s current industry converts the same price into share buybacks and dividends that leave the community. The households experiencing the price shock are the same. What differs is whether any of that money circulates back.
Brent has surged nearly 28 percent year-to-date and analysts are warning of $100 or higher if the Hormuz disruption persists. The starting conditions are worse on every dimension: higher rates, depleted fiscal buffers, weaker labor markets, and a demographic baseline with less margin than any previous shock hit.
Three assumptions underpin the current policy response, and none of them hold. Energy policy assumes the industry responds to prices, but consolidation and capital discipline ensures it will not. Standard monetary policy assumes supply-side self-correction will shorten tightening cycles, but higher interest rates aren’t going to move oil out of a war zone. Demographic policy targets family size among mothers when the evidence shows the binding constraint is the rate of entry into motherhood itself, ie young people’s very ability to get some economic stability in their lives. Each assumption was calibrated to conditions that no longer exist.
To the right: the American oil and gas industry are not coming to save you. The CEOs have said so publicly, on earnings calls, to shareholders, in plain English. $100 oil, $150 oil, $200 oil, and the production plan does not change without external pressure. The rigs are not coming back without a fight. Wall Street is hellbent on making sure roughnecks are not coming back. The wildcatters who would have responded to this price signal were bought out by ExxonMobil and Chevron, and those companies will return the windfall to shareholders, not to the Permian. “Drill, baby, drill” is a slogan for an industry that no longer exists. If you want energy prices down, you need every tool on the table, including the ones you have spent the last decade trying to kill.
To the left: you are fully aware that this war does not mean the economic damage manages itself. The Strait is closed. Prices are rising now. Every week without emergency action on refinery coordination and non-US diplomatic efforts to reopen shipping lanes is a week the damage compounds into the lives of the young workers, renters, and so many innocents. The window to prevent the downstream damage is closing fast.
1) Oil Companies got better at producing with lower labor cost. It's called productivity and it's good.
2) Oil companies decided not to rapidly and recklessly expand capacity during every boom, trying to be prudent with investment capital. This is good. If you think they are being too cautious get in the game yourself.
3) Renewables that require subsidies are un-economical welfare. Make work jobs that cost the government money are bad for society.